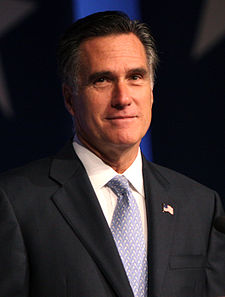
Mitt Romney
- Party
- Republican
- Office Sought:
- President
- State Candidancy or Office Held:
- See also: State profile for Mitt Romney
Willard Mitt Romney (born March 12, 1947) is an American businessman, and a Republican who was the 70th Governor of Massachusetts from 2003 to 2007, was a candidate in the 2008 U.S. presidential election, and is a likely candidate in the 2012 presidential election.
Source: Wikipedia
Campaign Finance
$122,243,710 Received
Information
Figures are based on itemized contributions reported to the Federal Election Commission and state agencies. Please note that:
- contributions under $200 are not reported, and so are not included in totals.
- only contributions from individuals and organizations to candidates are included. Various accounting measures and more exotic contribution types are excluded.
- contributions are matched based on organization and recipient name reported within each election cycle. Contributions using an incorrect or non-standard version of the name may be missed.
- corporate name changes and mergers may cause figures to differ from those of the Center for Responsive Politics.
- organization totals include known subsidiaries of the organization.
For more information, please see our campaign finance methodology page. Lobbyist bundling data is described on our lobbyist bundling methodology page.
Latest FEC Data
covers through candidate's May 31, 2012 filing. independent expenditures updated daily.
Download all contributions to Mitt Romney
Download all independent expenditures for or against Mitt Romney
-
Summary
overview of how much the candidate raised and spent, and who contributed it- Total Raised:
- $122,243,710 #2 of 38 Presidential candidates
- Total Spent:
- $106,589,123 #2 of 38 Presidential candidates
- Cash on Hand:
- $16,999,666 #2 of 38 Presidential candidates
-
Contributions Over Time
reflects only contributions over $200, as smaller contributions are not individually reported. For some candidates a significant portion of their fundraising may not be captured by this chart. -
Independent Expenditures
outside groups that spent money supporting or opposing the candidateCommittee Name Support/Oppose Total Spending Priorities USA Action Oppose$13,498,104 Restore Our Future, Inc. Support$6,624,202 Winning Our Future Oppose$3,912,909 Planned Parenthood Oppose$1,603,983 American Fedn of St/Cnty/Munic Employees Oppose$1,500,000 Citizens for a Working America PAC Support$930,000 Service Employees International Union Oppose$912,842 Red White And Blue Fund Oppose$687,307 League of Conservation Voters Oppose$544,561 Lcv Victory Fund Oppose$544,561
Donor Information
covers through 2011. may lag behind FEC section above, as donors and industries are identified by hand.-
Top Industries
OpenSecrets.org and FollowTheMoney.org classify contribution data into about 100 industries.71% of the total amount raised came from an identifiable industry. -
In State vs. Out of State
contributions from individuals, in dollars -
Top Contributors
- Employee Color Block
- Employees
- PAC Color Block
- PAC
-
Bundled Lobbyist Contributions
Lobbyists and lobbying firms that raised money from multiple donors on behalf of the politician. Contributions from the lobbyist or firm itself are not included.Bundler Amount Patrick Durkin, Barclays $167,800 T Martin Fiorentino Jr, Fiorentino Group $102,900 Wayne L Berman, Ogilvy Government Relations $101,600 Drew Maloney, Ogilvy Government Relations $56,750 David Beightol, Dutko Worldwide $54,200 Judith Rhines, Rath Group $34,200